Institutional Data Dashboards
The Institutional Data Dashboards powered by Power BI provide interactive ways to explore APSU's Institutional Data. This is our official data that are extracted at Census Date and when APSU's degree data is available at the end of the reporting year, and is subsequently “frozen”, that is locked down in our data warehouse. These data are saved every Fall term and consistent from year to year. Use these data to complete official reports, applications, or surveys.
Now, just click the button and begin to explore…
Open Institutional Data Dashboards in new window
Using the Dashboards
Power BI offers many helpful tools within the software to interact with the provided institutional data. Below are links to guide sections with written instructions and images that assist you with common tools and information when using the Power BI dashboards.
- Navigating Pages
- Using the Information Icon
- Filtering Data
- Data Drilling
- Focus Mode
- Sort Descending and Ascending
- Tooltips
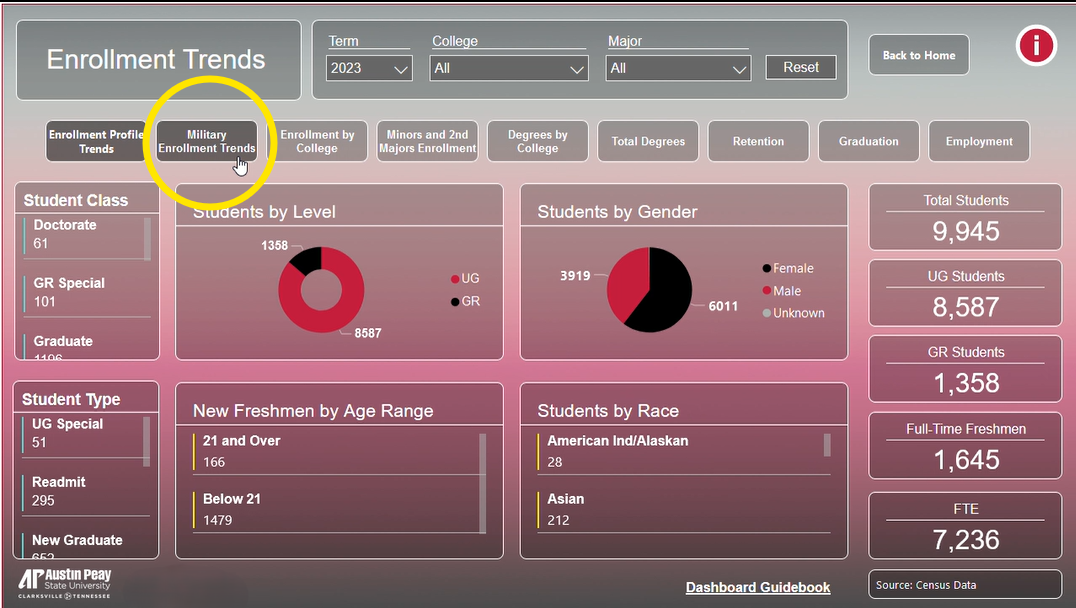
Navigating Pages
To navigate between the dashboards, click on the dashboard title needed. If you need to go back to the home page for more information about the dashboards, click the "Home" button in the top right area of the dashboard.
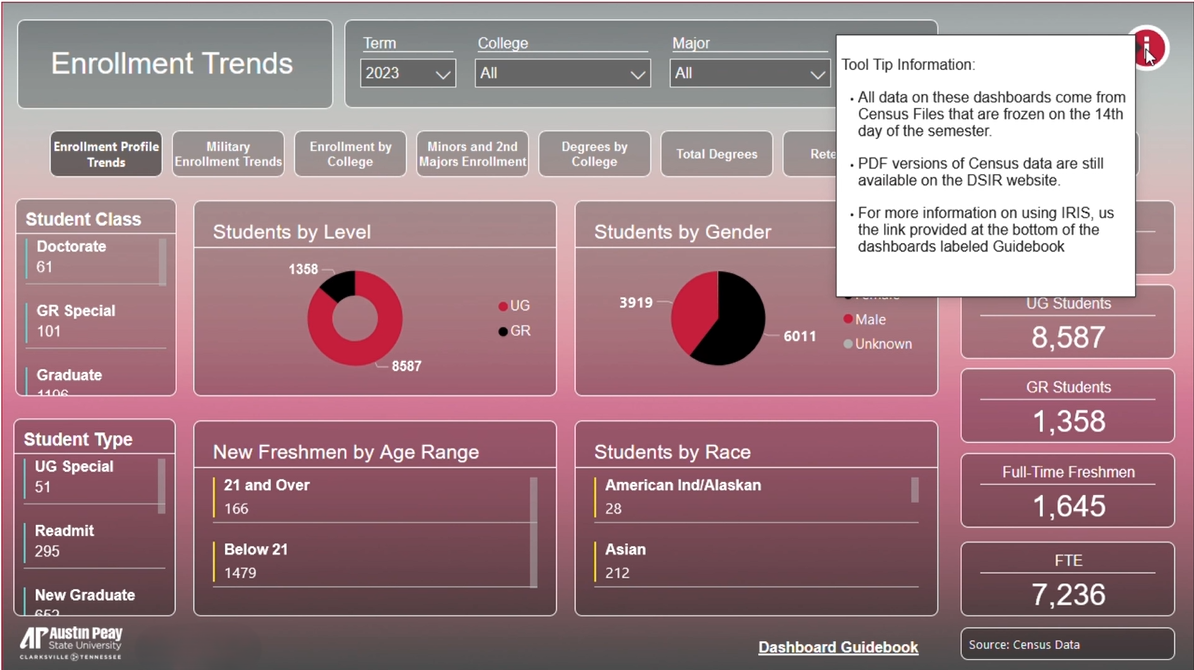
Using the Information Icon
To use the information icons, hover over the information icon to see general information about all dashboards.
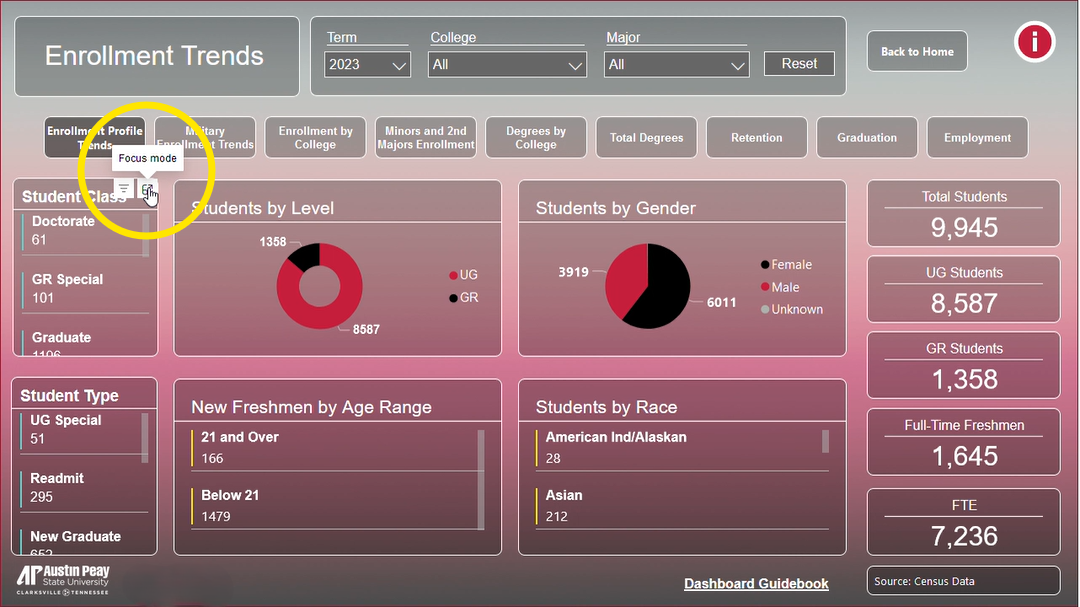
Focus Mode
To make a graphic or table larger, hover over the upper right corner of the graph and click focus mode.
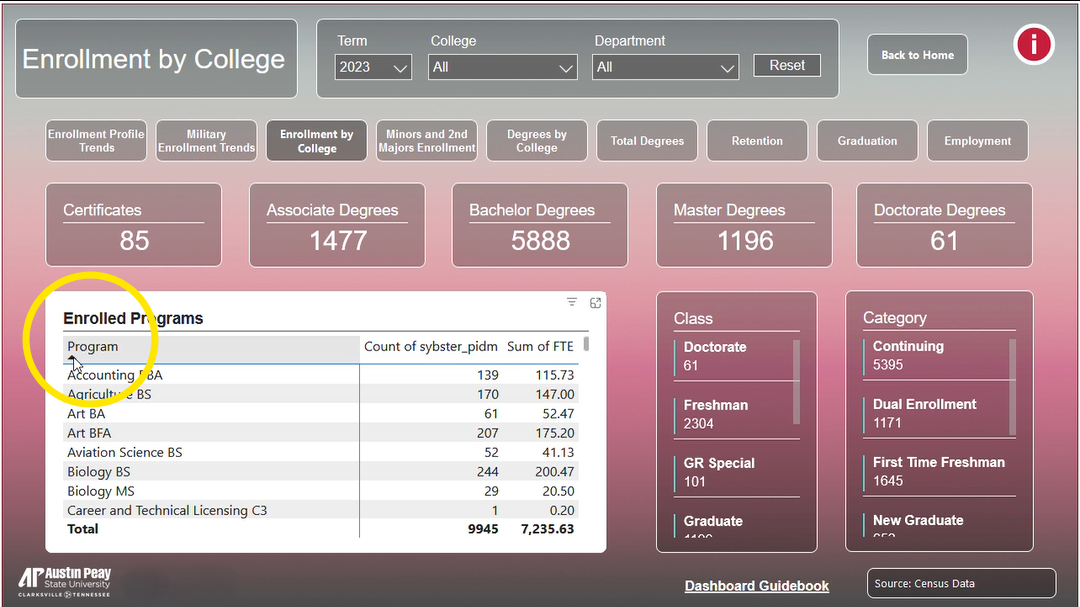
Sort Descending and Ascending
If you need to sort a table either ascending or descending, hover over the column and click the arrow to sort data.
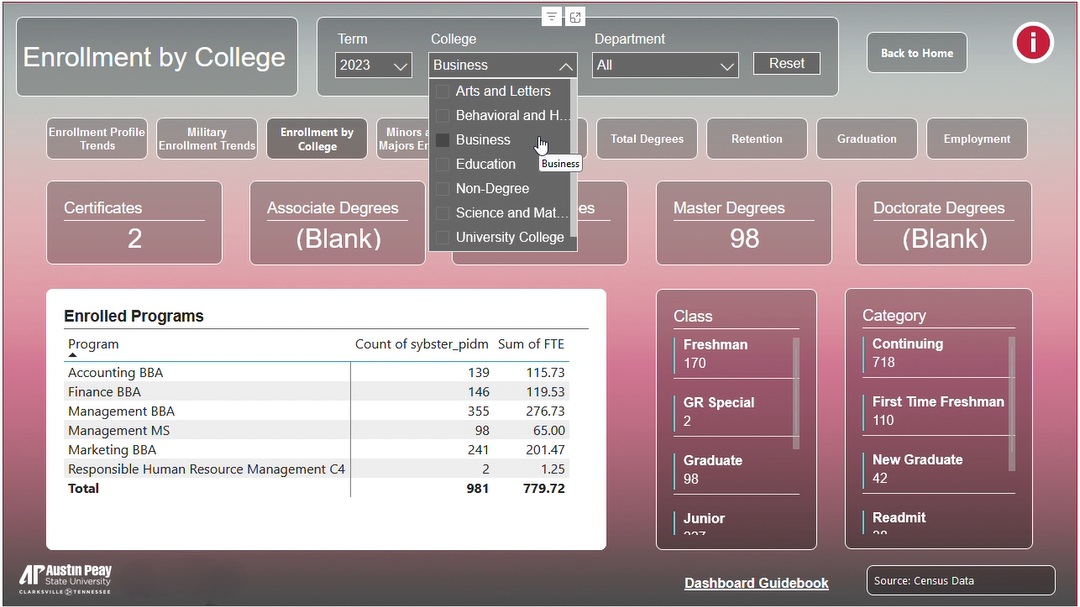
Filtering Data
Use the dropdown menus provided at the top of the dashboards to filter the data.
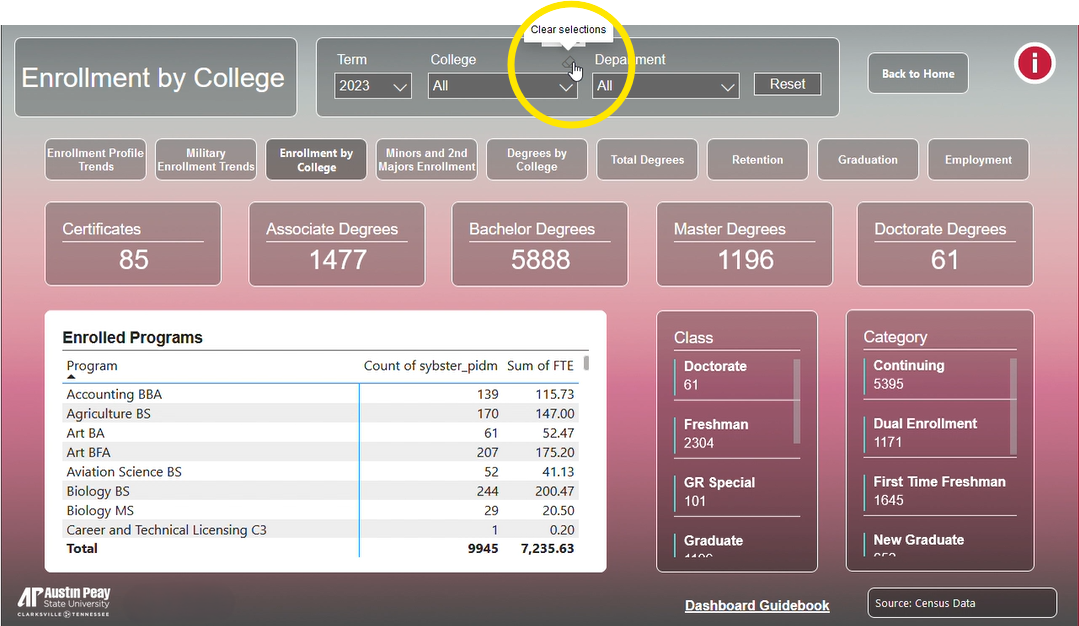
If you need to clear all selections in a filter dropdown, hover over the dropdown menu and click the eraser icon labeled "Clear Selections".
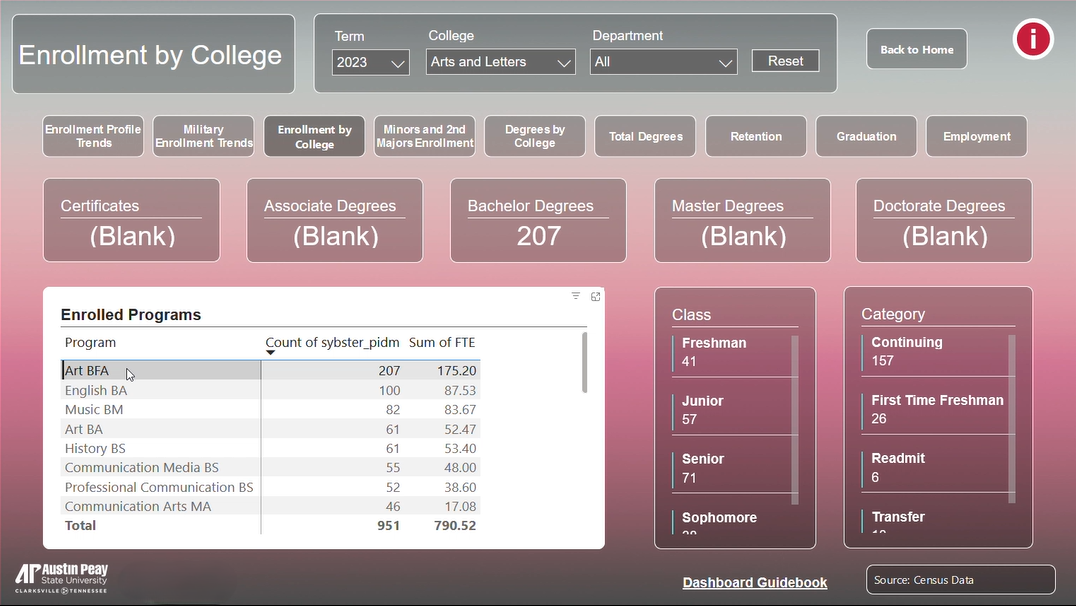
Data Drilling
Data Drilling allows you to interact with the data on a more detailed level. Click on any data attritube of a graph, table, or list to see data for that specific attribute.
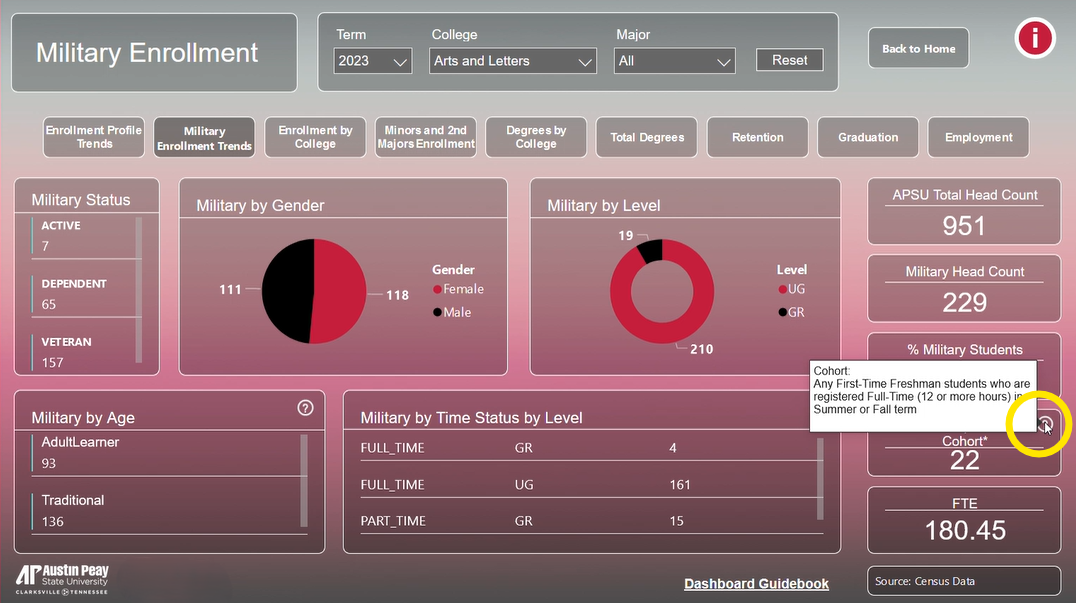
Tooltips
Tooltips are provided with some graphs and tables. Hover over the question mark to see an explanation of the data presented.